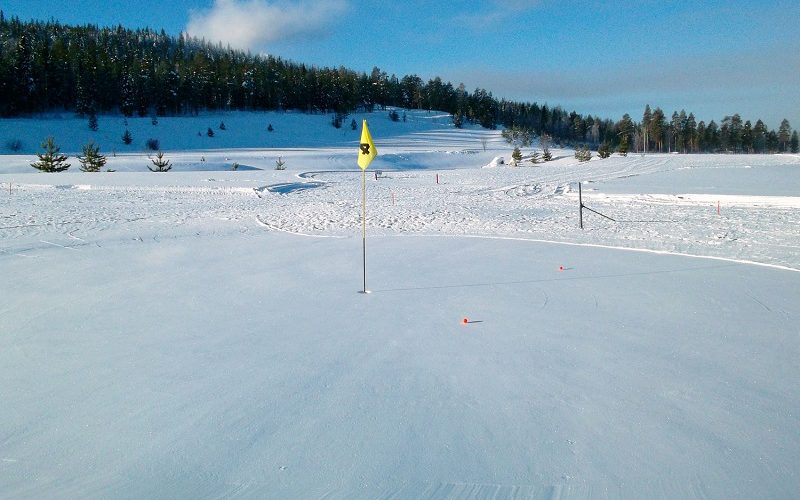
It’s hard to describe how cruelly weather treated the industry in 2018 but December brought down the curtain on a forgettable weather year as Golf Playable Hours (GPH) declined 7% compared to the same month last year. That result was unfortunately in line with the November Year-to-Date (YtD) deficit as we closed the year at -6% in GPH. Regional GPH breadth for the YtD period remained unfavorable at 1:5 with 7 favorable regions countered by 34 unfavorable regions (remaining 4 regions ended in the neutral zone of +/- 2%). Looking at weather impact performance by day-of-week for the YtD period, both weekparts (weekday & weekend) were down as well as every daypart (Mon-Fri.). As previewed last month, our weather crystal ball back in January of ’18 didn’t work very well this year compared to where we ended up but we have been signaling to Pellucid subscribers a forecast similar to where we ended up as early as June so they saw it coming and (hopefully) made contingency plans. The rest of you got blindsided or you spent the 2nd half of the year hoping it would get better. You can avoid that fate in ’19 by being a subscriber to our Pellucid Publications, Weather Impact or Cognilogic services. If that’s one of your New Year’s resolutions, you can subscribe to any of those products using the link at the end of this article.
Played Rounds data for November published by Golf Datatech followed Pellucid’s previous GPH guidance registering -19% for the month vs. Year Ago (ouch!). The silver lining to that tornado is that, after factoring in weather, Utilization was actually up as the played rounds loss was less than the capacity rounds decline for the month. For the YtD period, we’ll notch a marginal gain in Utilization for the year meaning we’ve managed to hold our own against an incredibly ugly weather year (both comparatively vs. ’17 and vs. the 10-year average). Beneath this national picture, there are winners and losers in both Played Rounds and Utilization Rates among the 61 key Markets (including Pellucid’s designated Top 25 markets) and this next-level-detail of results is also available to Pellucid Publications members and Geographic Weather Impact report subscribers.
Jim Koppenhaver comments, “The December weather results were once again a sea of red arrows for the vast majority of regions east of the Rockies but we did see some glimmers of hope in the SE Coast regions as well as SE Inland (Atlanta) for the closing month of the year. Looking at November YtD results for Utilization at the 61 markets level however, we continue the pattern of favorable breadth to gainers as rounds declines are shallower than weather unfavorability with a 3:1 ratio (18 markets showing Utilization gains against 5 markets showing declines with the remaining/majority 40 occupying the neutral zone). Among Pellucid’s Top 25 US Golf Markets for the YtD period, Utilization gainers are led by Orange County and Phoenix while Miami and
Dallas/Ft Worth are the leading laggards. Again, if you want to know which of our Top 25 Golf Markets posted Utilization gains, how much and what the dynamics are behind those gains, just go to our website and get on the Monthly Weather Impact subscription or sign up for Cognilogic (facility-level access via the web).”


