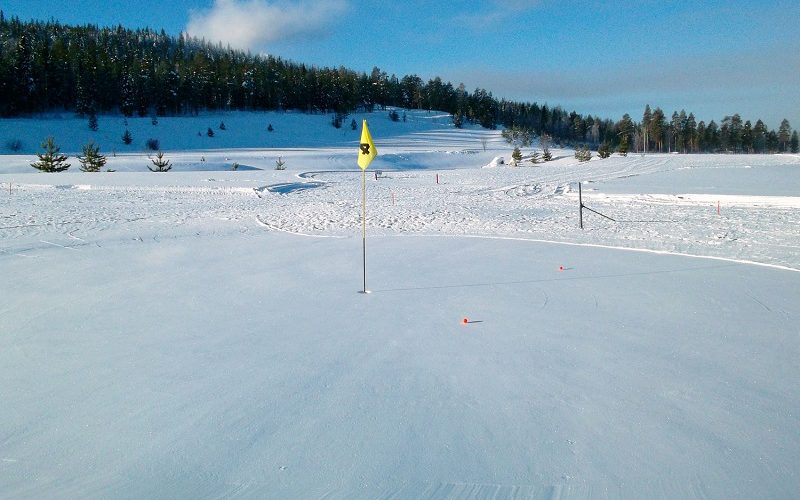
Earlier this month, Pellucid published details regarding metrics around the weather and its impact to rounds golf played in November. Remember, in much of the northern hemisphere, November is the last weeks of remotely playable golf (if they’re lucky). This is also helpful for a lot of courses to squeeze out every last ounce of course revenue before entering up to six months of pretty lean income. If you’re a golf course, you’ll take every cent you can get that time of year. I know I personally try to squeeze in a few last quality rounds of the year in November, and even the first couple of weeks of December. (My record for latest round or realistic reasonable golf is December 23rd.)
Well this year, November’s weather flat out succcccckkkked. It felt like it was bone-chilling freezing all month, and then in the final week, we got 10 inches of snow in Chicago that took forever to go away. But now, it’s just too cold and my playing season is toast. Until May, Tommy and I will just suck it up and suffer in freezing temperatures just to say we played golf. Or sneak in some rounds when we travel somewhere warmer than the arctic tundra that is Chicago.
Interestingly, October was disappointing as well according to Pellucid. I can’t say I don’t believe them because our weather had some rough spots too. I think I played once in October because of pouring rain or freezing temperatures essentially icing me out. Just wasn’t a good golf month as a whole.
If you want to read the whole write up from Pellucid, see below.
November Golf Weather Impact: Tough Sledding (even in warm climates)
November brought Black Friday to the golf industry as November Golf Playable Hours (GPH) declined 24% compared to the same month last year. That result seriously dented Year-to-Date (YtD) deficit which declined a full point to -6%. Regional GPH breadth for the YtD period also swung more unfavorable with a region ratio of 1:5 with 6 favorable regions countered by 33 unfavorable regions (remaining 6 regions are in the neutral zone of +/- 2%). Looking at weather impact performance by day-of-week for the YtD period, the deficit swung back to a weekday prominence and, among weekdays, all showing deficits. The year-end forecast (all 1 month of it left) is reflecting the challenging year and it appears that our January ’18 forecast was (uncharacteristically for Pellucid) too optimistic. Our Pellucid Publications, Weather Impact and Cognilogic clients are in-the-know on the day of week variances as well as the year-end forecast; if you’d like to be similarly enlightened and have early-warning guidance for marketing and expense decisions, you can subscribe to any of those products using the link at the end of this article.
Played Rounds data for October published by Golf Datatech also disappointed registering -10% for the month vs. YA (ouch!). The more insightful view, after factoring in weather, is that Utilization was significantly off, reflecting Pellucid’s previously-reported “down” (but not 10% down) weather for the month. For the YtD period, prior Utilization gains continue to erode as the deficit in Played Rounds marginally trails unfavorable weather results but at the national level we’re still slightly positive for the year. Beneath this national picture, there are winners and losers in both Played Rounds and Utilization Rates among the 61 key Markets (including Pellucid’s designated Top 25 markets) and this next-level-detail of results is also available to Pellucid Publications members and Geographic Weather Impact report subscribers.
Jim Koppenhaver comments, “The November weather results were even more universally poor than October for every region east of the Rockies. For the YtD period, there are only 6 of 45 regions showing GPH gains. Looking at October YtD results for Utilization at the 61 markets level however, we continue the pattern of favorable breadth to gainers as rounds declines are shallower than weather unfavorability with a 2:1 ratio (14 markets showing Utilization gains against 7 markets showing declines with the remaining/majority 40 occupying the neutral zone). Among Pellucid’s Top 25 US Golf Markets for the YtD period, 6 continue to show Utilization gains with Phoenix and Denver now showing 5+ pt gains (both driven by rounds increases, that’s encouraging). Again, if you want to know which of our Top 25 Golf Markets posted Utilization gains, how much and what the dynamics are behind those gains, just go to our website and get on the Monthly Weather Impact subscription or sign up for Cognilogic (facility-level access via the web).”
A broader and more detailed scorecard of the monthly key industry metrics can be found in Pellucid’s free digital magazine, The Pellucid Perspective. To register to get the current and future editions, go to http://www.pellucidcorp.com/news/elist, fill in the information and you’ll be registered for the next edition on 10/15/18.


